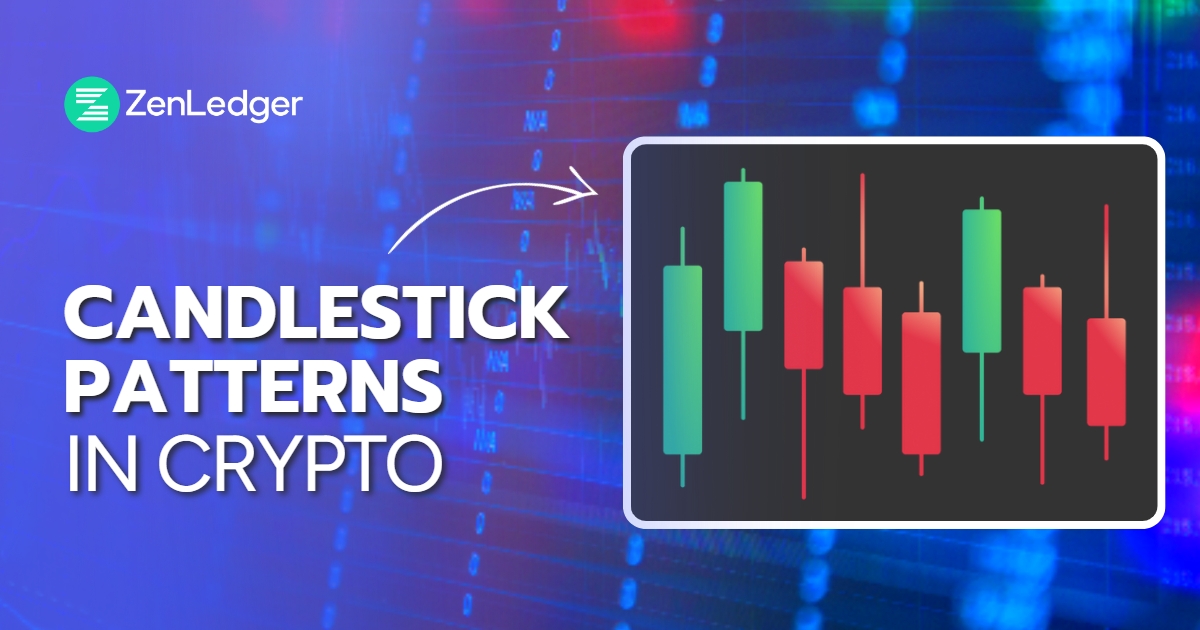
For crypto day traders, technical analysis is pre-eminent. It helps them buy, hold, and sell cryptocurrencies by interpreting possible market trends based on past patterns. One of these patterns is the candlestick pattern, which is both a technical tool and a graphical representation of how prices move. This makes them more useful than simple lines that are connected with dots. If you add color coding on top of this pattern, it can add more depth to this technical tool.
Understanding Candlestick Patterns
To understand the candlestick patterns, first, we have to understand the structure of this pattern. This is the structure:
Structure of a Candlestick
These are points in the body of a candlestick
- Open
- Close
- Wicks
First of all, it is called a “candlestick” because the graphical representation resembles a candle with a wick on either end. In a bullish pattern, the bottom of the candle symbolizes the opening price, and the top of the candle indicates the closing price. In a bearish pattern, it is the opposite. The wick, on the other hand, represents the highest and lowest prices reached during that time period.
Candlestick patterns can show how people feel and think about the market, and they can also be used to find possible buying and selling opportunities.
Let’s take a closer look at how to read this structure in order to interpret price movements.
How to Interpret Candlestick Patterns
As we’ve already mentioned, a candle tells us the opening and closing price of crypto for a given period at a glance. Other than that, you can also tell by the color of the body if a crypto’s price is rising or falling. The rectangular body of the candle, if dark (red or black), signifies a drop in price. If it is bright (green or white), it indicates an increase in price. The wicks tell us the maximum high or low of the day. For instance, if crypto candlestick charts are set for one month, then each candle symbolizes a day. If the chart has red candles back to back, it means the price is falling.
The wick tells us the highs and lows the cryptocurrency has reached. If the candle is red and the upper wick is short, it shows us that the coin opened near the high of the day. If the upper wick of a green candle is short, it indicates that the coin closed near the day’s high.
With that being said, let’s look at 16 different types of crypto candlestick patterns.
16 Candlestick Patterns
Six Bullish Candlestick Patterns
Most of the time, bullish patterns appear after a downtrend, which is when the price of crypto goes down from where it was. Bullish patterns are a signal for a price reversal, and traders usually open a position during this time to make profits from the upward trend. Let’s look at the six bullish patterns.
1. Hammer
It is a bullish reversal pattern that forms at the bottom of downtrends. It has a very short, almost non-existent upper body and a long lower shadow, which shows us that the asset’s price fell significantly during the given time period, but rose back up, indicating buying pressure. This pattern suggests that the asset may be ready to trend upwards.
2. Inverse Hammer
The inverted hammer candlestick pattern is similar to the hammer candlestick crypto pattern. It indicates that the buying pressure was strong during the given period of time. It also suggests that buyers will soon have control of the market and that the selling pressure was not enough to bring down the value of the market.
3. Bullish Engulfing
This pattern consists of two candlesticks. The first one is short, has a red body, and is covered by a larger green candle. Although the second day has a lower opening, the buying pressure pushes the price up, making it a win for buyers.
4. Piercing Line
This one is also a two-stick pattern. It has a long red candle, which is followed by a long green candle. There’s a big gap between the first candlestick’s closing price and the second candlestick’s opening price. This tells us that there’s strong buying pressure because the price moved above yesterday’s midpoint.
5. Morning Star
As the name suggests, it is looked upon as a sign of hope in dark times of a downtrend. This three-stick pattern consists of one short candle between a long red candle and a long green candle. This pattern shows that there is less pressure to sell and that a bullish trend is coming.
6. Three White Soldiers
It takes three days for this pattern to appear. It has long green candles that open and close higher than the previous day. It is a strong bull signal that comes after a downtrend.
Six Bearish Candlestick Patterns
Generally, bearish patterns on crypto candlestick charts take place after an uptrend. Negative sentiment about the market price affects the traders, and they sell their assets and open a short position to take advantage of the downtrend.
1. Hanging Man
It is the bearish equivalent of the hammer candlestick crypto pattern. Here, the shape is the same, but it forms at the end of an uptrend.
This pattern tells us that there has been a considerable sell-off, but buyers were able to create some buying pressure. This big sell-off tells us that the bears will control the market soon.
2. Shooting Star
It has the same shape as the inverted hammer, but it develops in an uptrend. The shooting star has a long upper wick and a small lower body.
When the market opens, it is marginally higher, and it rallies to an intra-day high before it closes at a price just above the open. This resembles a star falling.
3. Bearish Engulfing
This crypto candle pattern forms at the end of an uptrend. During this pattern, the first candle is small and green, and the subsequent candles are long and red.
This indicates a slowdown in price movement and an upcoming market downturn. If the second candle goes even lower, the trend becomes more prominent.
4. Evening Star
This is also a three-candlestick pattern and is identical to a bullish morning star. It has a short candle wedged between a long green and red candle.
This shows that the uptrend might end soon. This trend can be strong when the third candle cancels the first candle’s gains.
5. Three Black Crows
This crypto candle pattern has three back-to-back long red candles with very short or almost non-existent wicks. Each session may start with a similar price, but the prices go down with each close due to the selling pressure.
According to traders, this is the beginning of a bearish downtrend because sellers have controlled the market for three straight trading days.
6. Dark Cloud Cover
This candlestick pattern symbolizes a bearish reversal. It has two candlesticks: red and green. There’s the green one, and the red one opens above the green and closes lower than its midpoint.
The dark cloud cover pattern indicates that there is significant selling pressure and that prices are being pushed lower. If the wicks are really short, it indicates that the downtrend was very decisive.
Four Continuation Candlestick Patterns
If the candlestick pattern stays stagnant, it is called a continuation pattern. This is a time of market indecision and neutral price movement.
1. Doji
In the Doji candlestick pattern, the opening and closing prices are almost the same. Therefore, it looks like a plus or a cross sign with a different wick length. It means that the buyers and sellers are struggling with no gain on either side.
2. Spinning Top
This pattern has a short body with wicks of equal length. The spinning top shows indecision in the market, and there’s no significant change in price.
3. Falling Three Methods
This pattern is used to predict whether a bullish or bearish trend will stop or keep going. This pattern has a long red body, followed by small green bodies, and then another red body.
4. Rising Three Methods
In the rising three methods pattern, there are three short red candles wedged between two long green candles. This pattern indicates that although there’s some selling pressure, buyers have control of the market.
Conclusion
Candlesticks are a good place for people who are just starting out to look at the technical side of the crypto market and look at it closely. Also, given these many types of candlestick patterns, it might take some time for newbie traders to learn how to use them for trading. Lastly, they must not be used as absolute predictions of price movements.
Learn also about the cryptocurrency tax.


