
Crypto trading is a lucrative venture when done right. And to do it right, traders have to understand different types of charts and patterns. One such pattern is the bull flag. A lot of traders use this trading strategy as it helps them understand price moves, allows them to partake in trending markets, and lets them establish low-risk entries. But, what is the bull flag pattern? Let’s explore.
What is the Bull Flag Pattern?
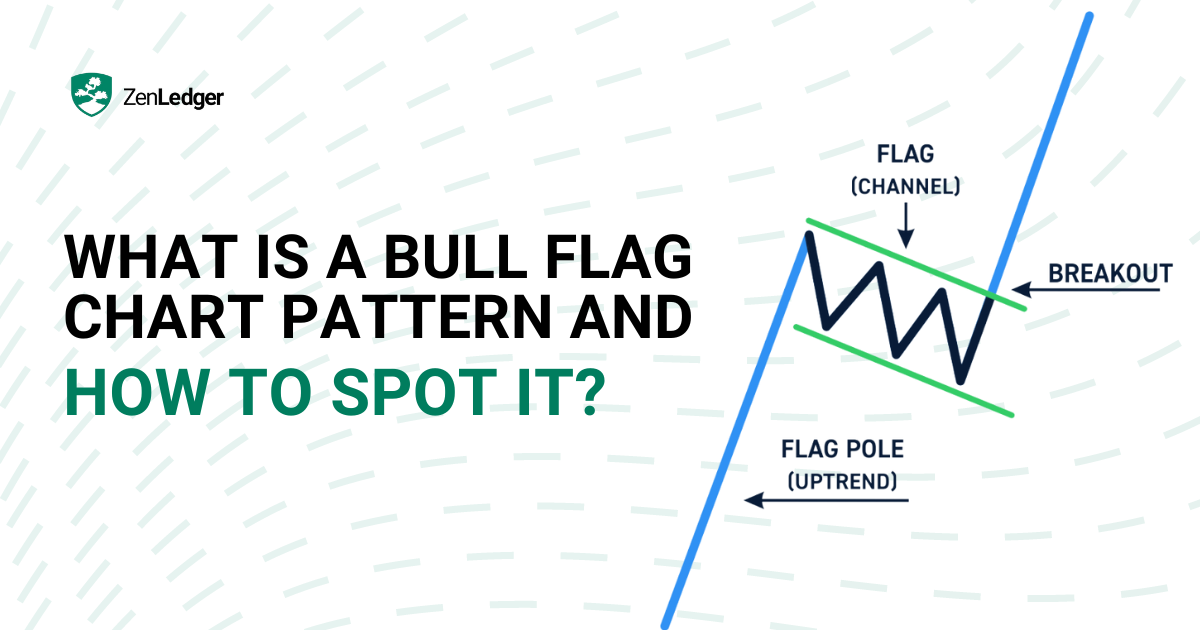
A bull flag chart pattern is a technical analysis pattern that is often used to identify potential buying opportunities in an uptrend. It is called a “bull flag” because it is typically seen as a continuation of the uptrend.
The bull flag pattern is formed when the price of a cryptocurrency makes a strong upward move, followed by a period of consolidation or sideways price action. The consolidation period is often characterized by a narrow range and lower volume and is typically referred to as the “flag” portion of the pattern.
Characteristics of a Bull Flag
If crypto traders can identify the bull flag pattern in real time, it gives them an edge over other traders. Here are the three stages of identifying the bull flag.
- Identifying the previous momentum: The first stage is to look for the previous momentum. This is usually represented by back-to-back bullish bars.
- Corrective action: The next stage is corrective action or “consolidation,” which consists of sideways movement.
- The break of the flag: The last stage is the break of the flag, which gives a perfect entry signal to traders.
Also, traders can ascertain the bull flag profit target by calculating the price distance between the base of the flagpole and the flag’s highest point.
How to Trade the Bull Flag?
Here are the simple steps to trade using the bull flag chart pattern:
Step 1: Identify the Pattern
The first step in identifying a bull flag pattern is to look for a strong uptrend in cryptocurrencies price.
Step 2: Mark the Consolidation Zone
After the uptrend, the price will typically enter a period of consolidation or sideways price action. This is often characterized by a narrow range and lower volume and is referred to as the “flag” portion of the pattern. If you are using platforms such as TradingView, zoom out of the chart and mark the consolidation zone. This will help you determine the next movement.
Step 3: Take a Long Position at the Breakout
The bull flag pattern is complete when the price breaks out of the consolidation range and begins to trend upwards again. This is typically seen as a signal to buy, as it suggests that the uptrend is likely to continue.
Step 4: Put a stop loss order below the flag.
It is important to set a stop-loss order when trading based on the bull flag pattern. This will protect against potential losses if the price does not move in the expected direction.
Step 5: Sell
It is completely up to the trader when they want to sell. However, they should keep an eye out if the price breaks out of the consolidation range to the downside. This can be a sign that the trend is reversing and that it is time to exit the trade. Another approach is to set a stop-loss order at a certain level below the current price, in case the trend does reverse and the price falls below that level, as explained in step 4.
Find out more about cryptocurrency trading here: Best Crypto Trading Bots
Bear Flag Pattern
A bear flag is a technical crypto flag pattern that is formed when the price of an asset experiences a sharp decline, followed by a period of consolidation or sideways movement. The pattern is named after the shape of the chart, which looks like a flag on a pole. The pole represents the sharp decline in price, while the flag represents the period of consolidation.
The bear flag pattern is typically seen as a bearish signal, as it suggests that the asset’s price is likely to continue to decline. This is because the sharp decline in price is often followed by a period of selling pressure, as traders and investors look to capitalize on the downward momentum.
To identify a bear flag pattern, traders and investors should look for a sharp decline in price, followed by a period of consolidation or sideways movement. The flag should have a downward slope, and the period of consolidation should be relatively short, typically lasting for a few days or weeks.
Traders and investors can use the bear flag pattern to help identify potential selling opportunities, as the pattern suggests that the asset’s price is likely to continue to decline.
Final Thoughts
The bull flag pattern is commonly used by traders as it shows the presence of a strong uptrend. With this pattern, traders who missed the initial surge of a cryptocurrency’s upward movement can still profit. However, it is important to use it in conjunction with other analysis techniques and to consider the overall market context before making any trades. It is also crucial to manage risk and maintain proper position sizing to ensure the success of any trading strategy.